Wind and Wireless
The Pulse in the Wires
The Living Proof
Last week, while discussing mesh networking over coffee, a fellow engineer showed me something that made the abstract concept of a "living mesh" suddenly tangible: the MeshSense live feed. "Look," he said, pointing to the scrolling terminal on his laptop. "This is the proof that we're not alone out there."
In decentralized networks where nodes come and go like fireflies in the night, that persistent scroll of activity is more than just diagnostics—it's a heartbeat. Each line represents a node announcing its presence, a connection being forged, or a packet finding its way home.
Decoding the Heartbeat
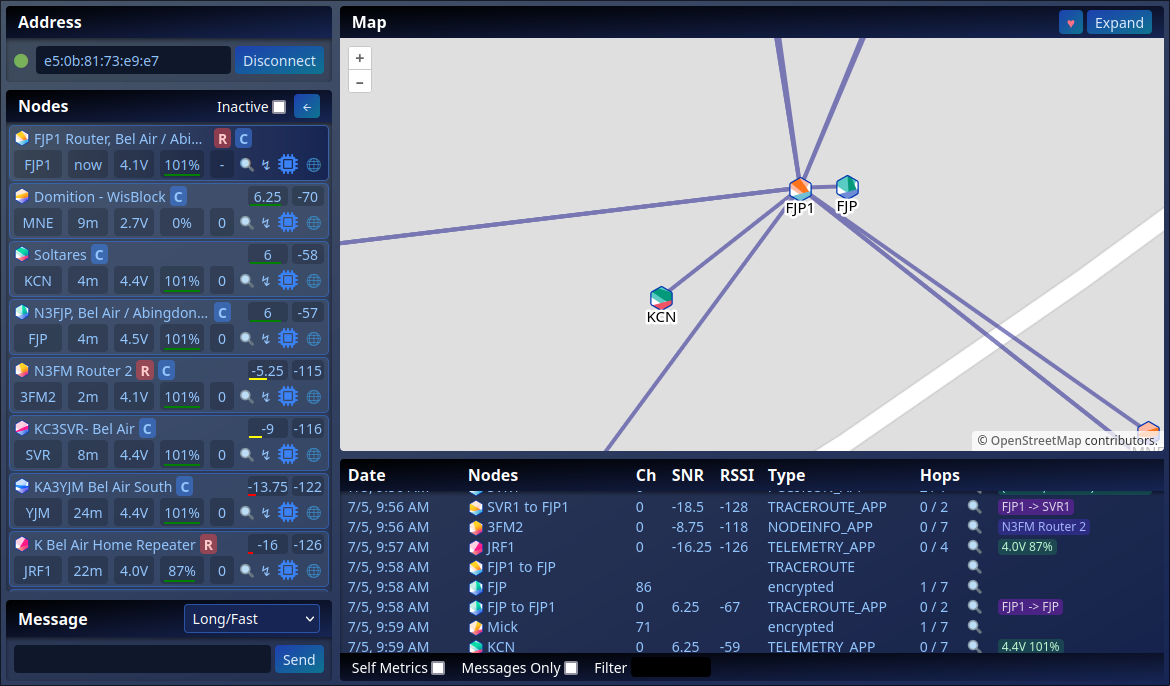
What makes this stream so magical? Let's break down a single pulse:
SFM2 Checking In
9:56 AM | SFM2 | Ch0 | SNR -8.75dB | RSSI -118
Translation: "NSFM Router 2" at Golden Gate Park reports good signal quality (SNR > -10dB) despite weak signal strength (RSSI). This node is alive and routing traffic.
JRF1 Battery Status
9:57 AM | JRF1 | TELEMETRY_APP
Translation: Junction Radio Node 1 reports healthy power (4.0V @ 87%). Someone's solar panel is working!
Encrypted Pathfinding
9:58 AM | FJP1 to FJP | Ch86 | encrypted
Translation: Mission node establishing private tunnel via channel 86. Real-world use happening right now.
Why the Live Feed Matters:
- Presence Validation: See neighbors' nodes waking up with the sunrise
- Network Vital Signs: Spot RSSI dips before they become outages
- Community Reassurance: That scroll is proof you're building something real
- Digital Campfire: Shared focus point for distributed maintainers
The Weather Patterns in the Data Stream
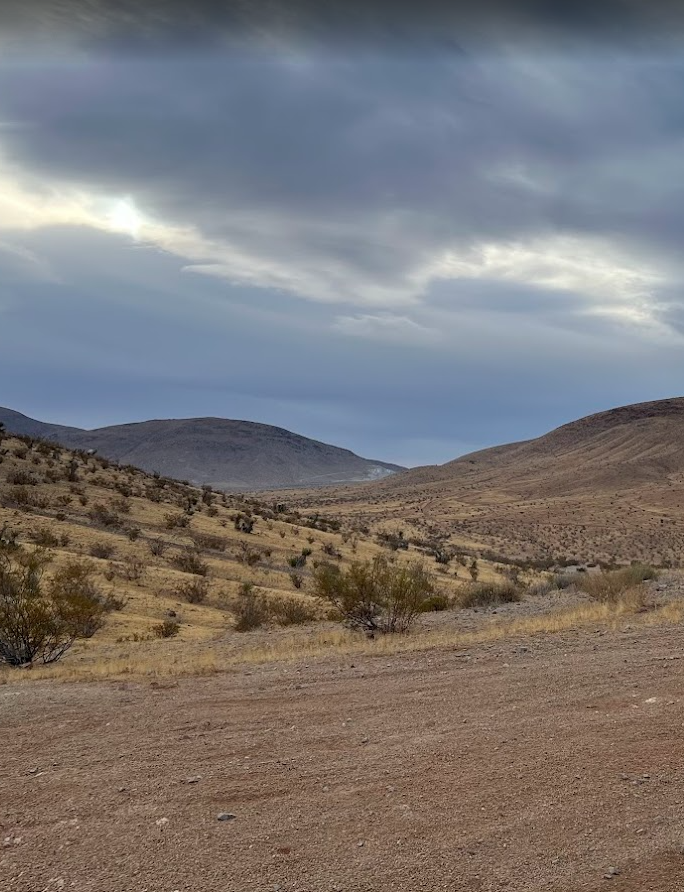
For the Solar Punk observing the live feed, battery percentages become a dance of electrons and atmosphere. During last month's stormy week, the MeshSense feed transformed into a barometer of resilience - each percentage point telling a story of solar panels battling clouds.
To the network gardener tending this digital ecosystem, that sudden jump from 68% to 94% at 3:20 PM speaks louder than any weather report. It's the moment when:
Sunlight Wins Over Silicon
The mesh becomes a sensor network measuring solar efficacy in real-time
Infrastructure Reveals Ecology
Battery curves map microclimates across the city
Energy Becomes Community Knowledge
Shared telemetry creates collective weather awareness
This is where MeshSense transcends monitoring - it becomes a conversation between technology and atmosphere. The Solar Punk sees not just percentages, but the invisible battle between photovoltaic cells and cumulonimbus clouds. That scrolling feed transforms into a living hymn to resilience, where every recharge is a small victory in the solar revolution.